Friday, November 29, 2019

Because Canvas is so bad at copying images/graphs/etc over, here is another image used in one of my quizzes:


This is an image showing the refractive index as a function of wavelength for several materials, considering visible wavelengths of light.


This image is taken from Douglas Giancoli's Physics for Scientists and Engineers, 4th Ed., Pearson Publishing (2014). I have modified it somewhat by removing some curves from it, and I am using it for educational purposes only.

Thursday, October 10, 2019

Uncertainty in the Expected Value: A Ballistic Pendulum

In considering error analysis for an experiment, we often treat the "experimental" values--the measurements which we make--as having some uncertainty (e.g. a standard deviation) and the theoretical value as being certain. This is not, however, always the case. For example, the "nominal" value of a thing--resistor, mass, pull strength, etc--often has associated with it some error. The resistance in a resistor is specified by its colored bands, with an uncertainty value* explicitly specified by the fourth colored stripe. Thus, the "nominal" value is not without some uncertainty.

Furthermore, the "theoretical" value--calculated from some curve--may often have some uncertainty of its own. After all, the theoretical curve from which the theory value may be obtained is itself computed using a set of measured values. As an example, consider the maximum change in height for a ballistic pendulum as a function of the projectile's mass. If the pendulum is shot at using a spring loaded gun to launch the projectile, then this maximum height should be calculatable using the following parameters: effective mass of the pendulum, mass of the projectile, spring constant of the spring, initial and final compression of the spring, mass of the driver used to propel the ball, frictional forces within the system.

The maximum displacement height for a ballistic pendulum as a function of the mass of the projectile. This particular pendulum had an effective mass of 75 grams, a driver assembly mass of 42 grams, and a spring of spring constant 2730 N/m and a measured compression of about 2.3 cm (solid curve).This is plotted with data (averaged 10 shots, with error bars being standard deviations of the means) as well as two enveloping lines (dashed lines) representing 0.5 mm more (gray) or 0.5 mm less (black) for the spring compression.
Now consider a spring-loaded projectile gun with a very stiff spring and a very short compression distance. Any difference in the measured compression distance will easily result in a noticeable shifting of the theoretical curve computed using this distance (see the image above). An error of only 0.5 mm in measuring the spring's compression--and this is a decent guess as the the uncertainty of the measurement, which was made using a ruler--could result in the maximum displacement height's being "off" by 1 cm. Thus, the uncertainty in the "theoretical" curve may be great enough that the entire curve could overestimate or underestimate most values of the displacement. Instead, the curve is a sort of "theoretical envelope" within which the experimental values should fall.


---
*Technically, this is the tolerance, and the uncertainty is much lower if the resistance is actually measured via an Ohmmeter.

Tuesday, October 8, 2019

Physics II Labs: Galvanometer and Voltmeter Diagram 1

Because Canvas is so bad at copying images/graphs/etc over, here is another image used in one of my quizzes:

This is a circuit diagram which shows a galvanometer which will be used to construct a simple voltmeter.

Tuesday, September 24, 2019

Sound in a Vacuum Chamber Pt. 2: Experiment

In the previous part to this, I briefly discussed the predicted relationship between ambient air pressure and sound intensity. I have in fact actually measured this relationship, and at a few different frequencies for sound.

Before I discuss the results, I should describe my setup. I have a small glass vacuum chamber, into which I place a handheld sound meter and a small bluetooth speaker. There is a simple analog pressure gauge on the vacuum chamber, and the bluetooth speaker is paired with my tablet. On my tablet, I run the app FREQUENCY SOUND GENERATOR ver. 2.30, which allows me to control frequency and volume output for the speaker.

The basic procedure is to turn on the vacuum pump, evacuate the chamber to the desired pressure level (air may be allowed back into the chamber as necessary). I then allow the chamber to stabilize its pressure, and I record the backround pressure as well as the sound level with the frequency generator turned "off." I turn on the speaker and play the sound at the pre-selected frequency and volume, and then record the detected sound intensity level from the sound meter. This value fluctuates a bit, so I estimate a rough average, which shows one area with room for improvement, I suppose.

Anyway, I have the data plotted below, for a set of three frequencies. The differences between the frequencies may give an approximation for the error involved--I don't expect frequency to make much difference, but I would need to repeat the experiment to confirm this.


Note that the fit is actually parabolic (quadratic, I ~ P^2), rather than linear (I~P) as predicted. I think that this may be a result of the detector's having some response to background pressure which is itself linear. The detector is, after all, basically just a condensor microphone, which detects intensity via variations of pressure which manifest in changes of the capacitor plate separation, hence capacitance, hence stored charge.


Tuesday, September 17, 2019

Ballistic Pendulum: Linear Momentum Conservation and the Effective Mass

The ballistic pendulum is a well-known apparatus in introductory physics courses. It is commonly used to illustrate some conservation laws:

  1. momentum conservation (before and after the projectile impacts the arm)
  2. energy conservation (after impact while swinging to its apex, and also during the firing sequence).

The second set of conservation laws--energy conservation--are generally agreed upon. The first set set--momentum conservation--are not exactly contested. However, some courses will present this as an angular momentum conserving collision, while others will present it as a linear-momentum conserving collision. It is my purpose to note briefly that the former can be approximated by the latter, if some appropriate conditions are met.

First, I should note that a series of articles appearing in The American Journal of Physics have shown that this is in fact an angular-momentum conserving collision, and that in fact linear momentum as such is not conserved. This was first noted by T.R. Sandin [1], and then again expanded upon by A. Sachs [2], by Enos Wicher [3], and by P.D. Gupta [4]. Sachs in particular found that linear momentum conservation works as a good approximation, to within a factor of R'/R, where R is the distance from pivot point to ball center of mass and R' is the radius of gyration for the ball and pendulum system. Thus, the muzzle velocity of the projected ball is predicted by linear momentum conservation to be
\$v = \frac{m+M}{m} \sqrt{2gh} \$
where m is the mass of the ball and M the mass of the pendulum arm. However, the actual muzzle velocity is in fact given by
\$v = \frac{m+M}{m} \sqrt{2gh} \frac{R'}{R} \$
For the bob-catcher on a rigid arm pendulum used by Sachs, this resulted in a ratio R'/R = 0.96, that is, the linear momentum conservation overestimates the muzzle speed by approximately 4%.

Gupta performed a further experiment in which a massive sleeve could be mounted to the rigid arm and fixed at different positions along the pendulum arm, thereby changing the moment of inertia but not the total mass of the pendulum. He found that the muzzle speed determined from linear momentum conservation exceeded the value determined by angular momentum conservation by as much as 12% for the ball-pendulum-sleeve-gun system used, and that in all cases the angular momentum conservation value more nearly matched the value obtained by measuring range for a fixed drop distance from the same gun. In other words, the conservation of angular momentum is the more accurate principle for modelling this interaction, and it actually tended to get the "correct value" of the muzzle speed within the margin of error of the experiment.

This brings us back to the question, is it wrong to use the conservation of linear momentum in discussing the ballistic pendulum experiment? Well, it depends on how accurate you want your results to be, and how dynamic (e.g. will you be changing the mass configuration of the pendulum?). We can use the conservation of linear momentum if we modify some terms, slightly. Consider the collision in question: a ball of mass m collides with and sticks to a pendulum of moment of inertia I at a point a distance R from the pendulum's axis of rotation (e.g. pivot point). We take the ball's radius r to be negligible, e.g. r<<R so the ball will act like a point mass. Our conservation laws give:
Angular Momentum, \$m R v_1 = m R v_2 + I \omega \$
Energy, \$ \frac{1}{2}m v_2 ^2 + \frac{1}{2} I \omega ^2 = (m + M \frac{R_cm}{R} ) g \Delta h \$

where M is the mass of the pendulum. We can, moreover, relate the angular speed of the pendulum to the instantaneous linear (tangential) speed of the ball after impact: \$ v_2 = R \omega \$ . Thus, our conservation conditions become

Angular Momentum, \$m R v_1 = m R v_2 + \frac{I}{R} v_2 \$, which can be solved for \$v_1 \$ to give \$v_1 = \frac{m + I/R^2 }{m} v_2 \$
Energy, \$ \frac{1}{2}m v_2 ^2 + \frac{1}{2} \frac{I}{R^2} v_2 ^2 = (m + M \frac{R_cm}{R} ) g \Delta h \$

We now note that the \$I/R^2 \$ term has the same dimension as a mass, and indeed we can define it as the effective mass \$ M_{eff} \$ of the pendulum: this is the mass which, if reduced to a point and placed at the location of the impact, would have the same moment of inertia as the pendulum itself. The term \$ \frac{R_cm}{R} M \$ also has this form of an  effective mass, and in fact is the same effective mass as found for the moment of inertia. By combining the two conservation conditions and solving through for the muzzle speed \$v_1 \$, we finally obtain

\$v_1 = \frac{m + M_{eff} }{m} \sqrt{2 g \Delta h } \$

Which is essentially the same equation we obtained for the muzzle speed using linear momentum conservation.

---
References (articles linked in citation numbers, but they are mostly behind a paywall)

[1] T.R. Sandin, "Nonconservation of Linear Momentum in Ballistic Pendulums," American Journal of Physics, vol. 41 no. 3, 426-427 (1973).

[2] A. Sachs, "Blackwood pendulum experiment revisited," American Journal of Physics, vol. 44 no. 2, 182-183 (1974).

[3] Enos Wicher, "Ballistics pendulum," American Journal of Physics, vol. 45 no 7, 681-682 (1977).

[4] P.D. Gupta, "Blackwood pendulum experiment and the conservation of linear momentum," American Journal of Physics, vol. 53 no. 3, 267-269 (1985).

Wednesday, September 11, 2019

Physics II Labs: SHO Mass on Spring Position and Acceleration vs Time Graph 200 Grams Mass

Because Canvas is so bad at copying images/graphs/etc over, here is another image used in one of my quizzes:


This is a pair of graphs. The first is position as a function of time, and the second is aceleration as a function of time. Both are for the same motion, which involved a 200 gram mass placed at the end of a spring and then displaced from equilibrium (x = 0).

Physics II Labs: SHO Mass on Spring All Graphs with Equation Fits 200 Grams Mass

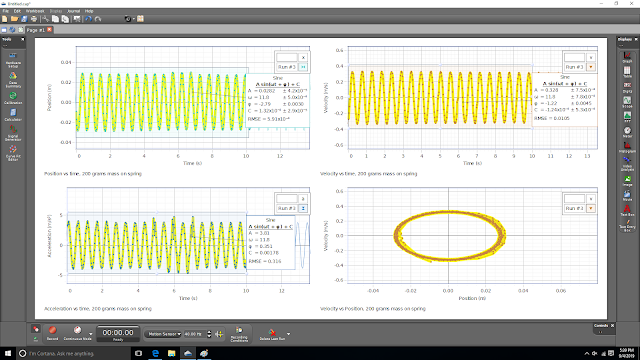
Because Canvas is so bad at copying images/graphs/etc over, here is another image used in one of my quizzes:


This is a complete set of graphs. The first is position as a function of time, the second is velocity as a function of time, the third is acceleration as a function of time, and the third shows velocity vs position. These graphs are for the same motion, which involved a 200 gram mass placed at the end of a spring and then displaced from equilibrium (x = 0). A sine function has been fit to each of the first three graphs.

Physics II Labs: SHO Mass on Spring Position and Velocity vs Time Graph 200 Grams Mass

Because Canvas is so bad at copying images/graphs/etc over, here is another image used in one of my quizzes:


 This is a pair of graphs. The first is position as a function of time, and the second is velocity as a function of time. Both are for the same motion, which involved a 200 gram mass placed at the end of a spring and then displaced from equilibrium (x = 0).

Physics II Labs: SHO Mass on Spring Position and Velocity vs Time EQN Fit Graph 200 Grams Mass

Because Canvas is so bad at copying images/graphs/etc over, here is another image used in one of my quizzes:


 This is a pair of graphs. The first is position as a function of time, and the second is velocity as a function of time. Both are for the same motion, which involved a 200 gram mass placed at the end of a spring and then displaced from equilibrium (x = 0). A sine function has been fit to each of these graphs.

Physics II Labs: SHO Mass on Spring Acceleration vs Time EQN Fit Graph 200 Grams Mass

Because Canvas is so bad at copying images/graphs/etc over, here is another image used in one of my quizzes:


 This is a graph of the acceleration as a function of time for a 200 gram mass placed at the end of a spring and then displaced from equilibrium (x = 0). A sine function has been fit to this graph.

Physics II Labs: SHO Mass on Spring Velocity vs Time EQN Fit Graph 200 Grams Mass

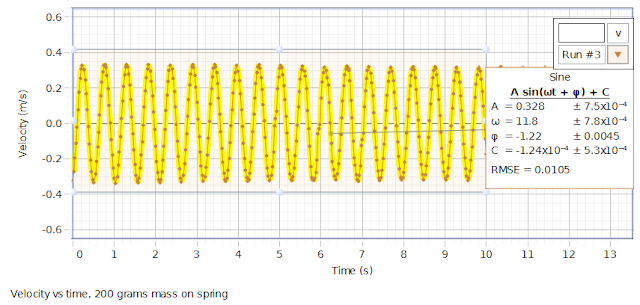
Because Canvas is so bad at copying images/graphs/etc over, here is another image used in one of my quizzes:

 This is a graph of the velocity as a function of time for a 200 gram mass placed at the end of a spring and then displaced from equilibrium (x = 0). A sine function has been fit to this graph.

Tuesday, September 10, 2019

Sound in a Vacuum Chamber Pt. 1: Prediction

As a fun demo, I have placed a bluetooth speaker into a vacuum chamber, and then pumped the air out of the chamber. Before pumping the chamber down, you can hear the bluetooth device, albeit faintly; after removing all of the air, it becomes inaudible. This is as should be expected, since the absence of air means that there is no medium for the sound waves to travel through (the device is suspended by a thin wire so that it is not touching any of the chamber walls).

This short demonstration is little different from the cellphone under a vacuum bell-jar demonstration which is described by Mr. Christian Villa in a short write-up for The Physics Teacher. In this demonstration, a cellphone is placed under a bell-jar. A call is placed to the phone, which lights up and then it can be heard ring, although "the jar's thickness alone considerably attenuated the sound." The bell jar is then evacuated of air, and the cell phone is again called, and it again lights up, but this time no sound can be heard. Air is then re-introduced to the jar, the phone is called a third time, and now when the screen lights up the ringtone can be heard.

I wanted to take this idea a step farther by measuring the sound intensity as a function of pressure. The predicted relationship between intensity and ambient pressure is
Where I is the intensity,  is frequency of sound,  is the amplitude of the sound wave particle displacement is speed of sound, and  is density of medium in which sound is traveling. The speed of the sound wave is dependent on density and bulk modulus, the frequency is determined by the source frequency, and the amplitude is determined by the source amplitude. Ultimately, this means that the intensity is directly proportional to the ambient density of the air, so via the ideal gas law, , so the sound wave intensity should be linearly proportional to the ambient pressure: we expect I = a P, where P is the pressure and a is a constant which accounts for frequency, amplitude, speed, etc. Thus, doubling the pressure of the chamber should double the intensity of the sound emitted from a speaker, assuming no other changes.



Monday, September 9, 2019

Physics II Lab: Electric Field Lines

Because Canvas is defective and often fails to do a simple task such as correctly copying an image from one shell to another, here is another image used in one of my quizzes:

These are possible equipotential curves for various charge configurations (or distributions).

Physics II Lab: Electric Field Lines

Since Canvas is defective and does not always copy over quiz images, here is another image from one of my quizzes:

These are electric field lines for various configurations.

Thursday, September 5, 2019

Physics II Lab: SHO Mass on Spring EQN Fit Graphs

Because Canvas is so bad at copying images/graphs/etc over, here is another image used in one of my quizzes:


This is a set of graphs: the position as a function of time, the velocity for a function of time, and the acceleration as a function of time, as well as the velocity as a function of position, for a 200 gram mass placed at the end of a spring and then displaced from equilibrium (x = 0). The first three graphs have each been fitted to a sine-of-best-fit equation.

Physics II Lab: SHO Mass on Spring Position v Time EQN Fit Graph

Because Canvas is so bad at copying images/graphs/etc over, here is another image used in one of my quizzes:


This is a graph of the position as a function of time for a 200 gram mass placed at the end of a spring and then displaced from equilibrium (x = 0). A sine function has been fit to this graph.

Physics II Lab: SHO Mass on Spring Position v Time Raw Data Graph

Because Canvas is so bad at copying images/graphs/etc over, here is another image used in one of my quizzes:

This is a graph of the position as a function of time for a 200 gram mass placed at the end of a spring and then displaced from equilibrium (x = 0).

Wednesday, September 4, 2019

Physics II Lab: Waves on String Q2 Diagram

Because Canvas is so bad at copying images/graphs/etc over, here is another image used in one of my quizzes:


It's a diagram with nodes and anti-nodes depicted.

When? Where? A Quick Thought About Kinematics Problems

I was helping a student to work through some simple kinematics problems today, and the following conversation (paraphrased) occurred:

Question on board: A motorcycle is stopped at a traffic light. The light changes, and the motorcycle accelerates steadily at a rate of 3.5 m/s^2 for 4.0 s.... When will the motorcycle's speed be 10 m/s?
Student: Which term is this asking the value of?
Me: Well, the question is asking when an event will occur...
Student: So I am trying to find the distance from the start where the motorcycle will have that speed?
Me: No, that question would be 'Where does the motorcycle reach a speed of 10 m/s, not when will it reach this speed.'

Seeing that the student was still confused, I explained that the word with which we start the question is also a clue for what the question wants us to find (English is this student's native language). What I also realized from this interaction is this: while the wording of the question should give the right clue (when refers to time, where to place), there is a sort of cultural conditioning which we should not ignore. After all, when a child riding in a long car trip asks his parents, "When will we get there?," his mother and father are as likely to answer "in another 10 miles" as to say "in another 10 minutes." Thus, at a young age we are trained to conflate distance with duration.

Tuesday, September 3, 2019

Physics I Lecture: Kinematics 1-D Quiz Graph

Canvas is terrible at copying graphs over (a series):
The above graph shows the velocity of a certain jogger as a function of time over the courses of 1 minutes.

Introduction


Welcome to my blog. I have started this for a few reasons:

  1. A major research site, which includes a blog with regular posts which are of sufficient quality to be considered for cited sources in others' scholarly activity counts as a "List B" item for tenure/promotion under "scholarly activity." Usually, people in hard sciences don't really get the benefit of this, but I thought I  might give it a try. Hopefully, the quality and quantity will be sufficient to meet this purpose.
  2. Our learning management system, Canvas, has ticked my off one time too many by failing to correctly copy images (graphs, data tables, etc.) from development shell to actual course. It happens completely at random, at least once per semester. Therefore, I intend to have a few posts here which are only a single image/graph/table, maybe with a caption. These are then linked from my quizzes in Canvas. It's a workaround, but better than continuing in a business-as-usual approach, which isn't working.
  3. Often times I have ideas which I simply won't have time to pursue. I'll put some of those here, if I think to do it. Other times, I will reach a dead-end on some project or other, or find that it doesn't quite fit the mold for publishing. 
  4. Likewise, some of what I do is just verifying someone else's work, which is not usually something which can be published or presented elsewhere.
  5. Finally, I am doing this because I enjoy writing my thoughts down. Sometimes, it helps me to clarify my thoughts. Sometimes, it gives me new ideas to pursue.


I hope that this blog fulfills its purpose. I also hope that you enjoy it. If not, it will at least serve its purpose as a repository for images and graphs to be used on my online quizzes and tests. So, there's that.