Showing posts with label Lab Projects. Show all posts

Friday, March 13, 2020

Light Bulb Experiment: DC Voltage?

In continuation of my previous post on this topic, I have set up my lightbulb with a 2.2 V DC voltage for 10 minutes and measured the resulting output voltage and current:

Over time, the current declines somewhat--exponentially, in fact--whereas the voltage measured across the bulb remains ~constant. The implication here is that the resistance of the bulb slowly increases with time, presumably until it reaches some quasi-steady-state temperature (and hence resistance).

The implication for this is that the "linear" regimes of the lightbulb's voltage-current curves aren't actually entirely linear. That said, they appear to be reasonably close to linear over the short-term (~2-10 seconds) considered in the ramps yesterday, at least as observed using a DC signal. In fact, I will close by posting a set of four more images, to compare the upper/lower linear regions for short time ramps to longer time ramps.
Here is the upper linear region linear fit with a 0.002 Hz frequency (500 s period):

And here is the lower linear region fit, for the same data:

Now let's look at a 0.2 Hz signal (5 s period), beginning again with the upper linear region:

And the lower linear region:

That's it for today. Next week, God willing, I would like to start looking at the intensity output for the light bulb. Preview question: if we treat the resistance as constant when the bulb is "on", we should expect to get what type of graph for intensity vs voltage and intensity vs current?

Thursday, October 10, 2019

Uncertainty in the Expected Value: A Ballistic Pendulum

In considering error analysis for an experiment, we often treat the "experimental" values--the measurements which we make--as having some uncertainty (e.g. a standard deviation) and the theoretical value as being certain. This is not, however, always the case. For example, the "nominal" value of a thing--resistor, mass, pull strength, etc--often has associated with it some error. The resistance in a resistor is specified by its colored bands, with an uncertainty value* explicitly specified by the fourth colored stripe. Thus, the "nominal" value is not without some uncertainty.

Furthermore, the "theoretical" value--calculated from some curve--may often have some uncertainty of its own. After all, the theoretical curve from which the theory value may be obtained is itself computed using a set of measured values. As an example, consider the maximum change in height for a ballistic pendulum as a function of the projectile's mass. If the pendulum is shot at using a spring loaded gun to launch the projectile, then this maximum height should be calculatable using the following parameters: effective mass of the pendulum, mass of the projectile, spring constant of the spring, initial and final compression of the spring, mass of the driver used to propel the ball, frictional forces within the system.

The maximum displacement height for a ballistic pendulum as a function of the mass of the projectile. This particular pendulum had an effective mass of 75 grams, a driver assembly mass of 42 grams, and a spring of spring constant 2730 N/m and a measured compression of about 2.3 cm (solid curve).This is plotted with data (averaged 10 shots, with error bars being standard deviations of the means) as well as two enveloping lines (dashed lines) representing 0.5 mm more (gray) or 0.5 mm less (black) for the spring compression.
Now consider a spring-loaded projectile gun with a very stiff spring and a very short compression distance. Any difference in the measured compression distance will easily result in a noticeable shifting of the theoretical curve computed using this distance (see the image above). An error of only 0.5 mm in measuring the spring's compression--and this is a decent guess as the the uncertainty of the measurement, which was made using a ruler--could result in the maximum displacement height's being "off" by 1 cm. Thus, the uncertainty in the "theoretical" curve may be great enough that the entire curve could overestimate or underestimate most values of the displacement. Instead, the curve is a sort of "theoretical envelope" within which the experimental values should fall.


---
*Technically, this is the tolerance, and the uncertainty is much lower if the resistance is actually measured via an Ohmmeter.

Tuesday, September 24, 2019

Sound in a Vacuum Chamber Pt. 2: Experiment

In the previous part to this, I briefly discussed the predicted relationship between ambient air pressure and sound intensity. I have in fact actually measured this relationship, and at a few different frequencies for sound.

Before I discuss the results, I should describe my setup. I have a small glass vacuum chamber, into which I place a handheld sound meter and a small bluetooth speaker. There is a simple analog pressure gauge on the vacuum chamber, and the bluetooth speaker is paired with my tablet. On my tablet, I run the app FREQUENCY SOUND GENERATOR ver. 2.30, which allows me to control frequency and volume output for the speaker.

The basic procedure is to turn on the vacuum pump, evacuate the chamber to the desired pressure level (air may be allowed back into the chamber as necessary). I then allow the chamber to stabilize its pressure, and I record the backround pressure as well as the sound level with the frequency generator turned "off." I turn on the speaker and play the sound at the pre-selected frequency and volume, and then record the detected sound intensity level from the sound meter. This value fluctuates a bit, so I estimate a rough average, which shows one area with room for improvement, I suppose.

Anyway, I have the data plotted below, for a set of three frequencies. The differences between the frequencies may give an approximation for the error involved--I don't expect frequency to make much difference, but I would need to repeat the experiment to confirm this.


Note that the fit is actually parabolic (quadratic, I ~ P^2), rather than linear (I~P) as predicted. I think that this may be a result of the detector's having some response to background pressure which is itself linear. The detector is, after all, basically just a condensor microphone, which detects intensity via variations of pressure which manifest in changes of the capacitor plate separation, hence capacitance, hence stored charge.


Tuesday, September 10, 2019

Sound in a Vacuum Chamber Pt. 1: Prediction

As a fun demo, I have placed a bluetooth speaker into a vacuum chamber, and then pumped the air out of the chamber. Before pumping the chamber down, you can hear the bluetooth device, albeit faintly; after removing all of the air, it becomes inaudible. This is as should be expected, since the absence of air means that there is no medium for the sound waves to travel through (the device is suspended by a thin wire so that it is not touching any of the chamber walls).

This short demonstration is little different from the cellphone under a vacuum bell-jar demonstration which is described by Mr. Christian Villa in a short write-up for The Physics Teacher. In this demonstration, a cellphone is placed under a bell-jar. A call is placed to the phone, which lights up and then it can be heard ring, although "the jar's thickness alone considerably attenuated the sound." The bell jar is then evacuated of air, and the cell phone is again called, and it again lights up, but this time no sound can be heard. Air is then re-introduced to the jar, the phone is called a third time, and now when the screen lights up the ringtone can be heard.

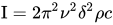
I wanted to take this idea a step farther by measuring the sound intensity as a function of pressure. The predicted relationship between intensity and ambient pressure is
Where I is the intensity,  is frequency of sound,  is the amplitude of the sound wave particle displacement is speed of sound, and  is density of medium in which sound is traveling. The speed of the sound wave is dependent on density and bulk modulus, the frequency is determined by the source frequency, and the amplitude is determined by the source amplitude. Ultimately, this means that the intensity is directly proportional to the ambient density of the air, so via the ideal gas law, , so the sound wave intensity should be linearly proportional to the ambient pressure: we expect I = a P, where P is the pressure and a is a constant which accounts for frequency, amplitude, speed, etc. Thus, doubling the pressure of the chamber should double the intensity of the sound emitted from a speaker, assuming no other changes.