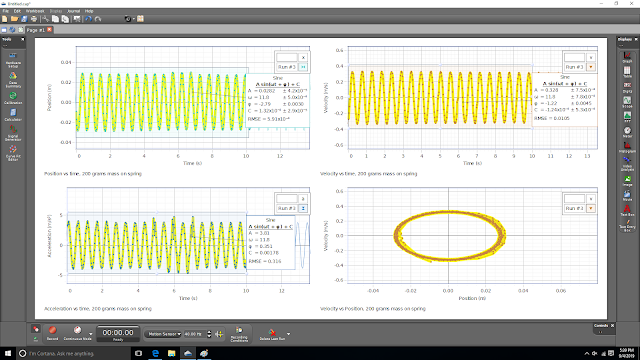
Because Canvas is so bad at copying images/graphs/etc over, here is another image used in one of my quizzes:
This is a set of graphs: the position as a function of time, the velocity for a function of time, and the acceleration as a function of time, as well as the velocity as a function of position, for a 200 gram mass placed at the end of a spring and then displaced from equilibrium (x = 0). The first three graphs have each been fitted to a sine-of-best-fit equation.

No comments:
Post a Comment